Understanding your analytics
Clicks, unique visitors, bounce rate, geo, device, and referrer breakdowns.
Updated February 20, 2026analytics, clicks, geo
Understanding your analytics
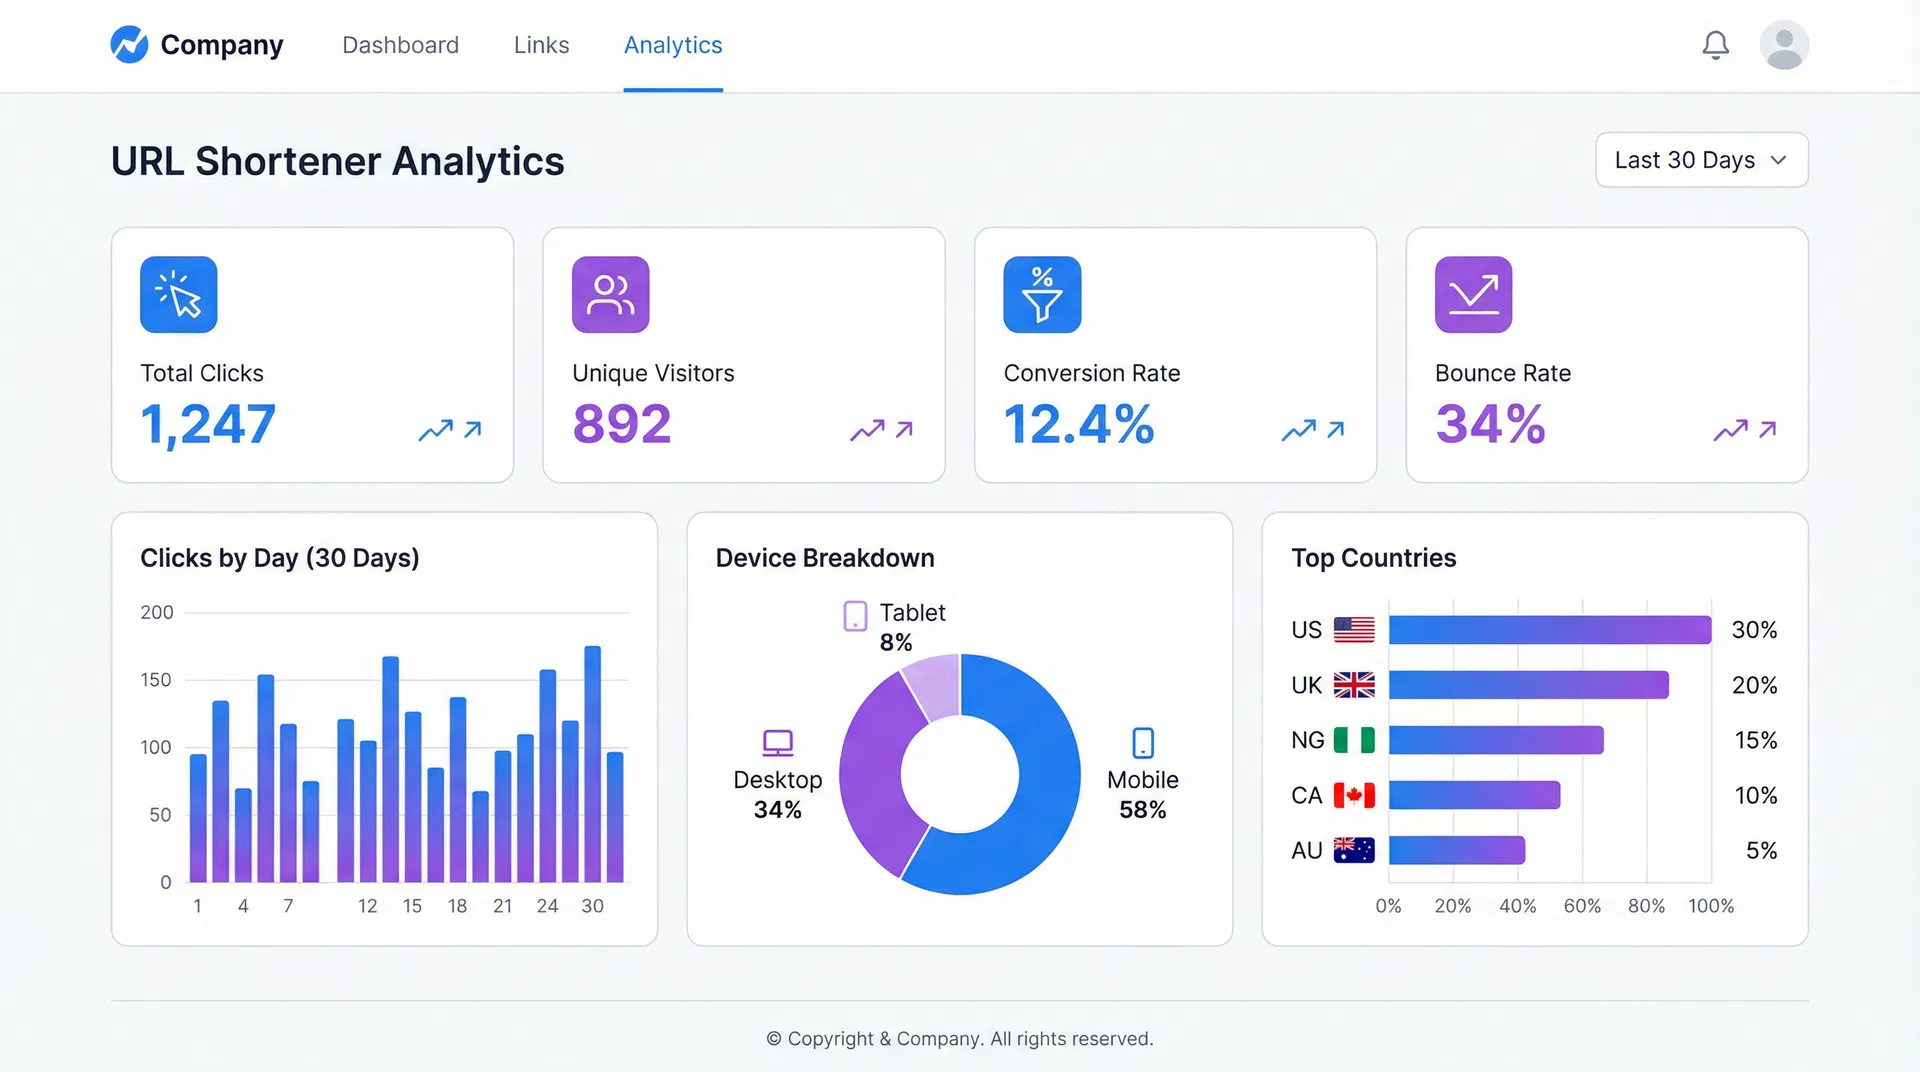
Lynkd tracks every click on your short links and breaks the data down into several dimensions.
Metrics explained
| Metric | Definition |
|---|---|
| Total clicks | Every redirect served, including repeat visits from the same browser. |
| Unique visitors | Distinct visitors identified by a hashed fingerprint (IP + user-agent). |
| Landed | Visitors who stayed on the destination page for at least 3 seconds. |
| Bounced | Visitors who left the destination page in under 3 seconds. |
| Converted | Visitors who submitted a Lynkd lead capture form on the destination page. |
| Repeat rate | Percentage of total clicks that came from a visitor who had already clicked before. |
Dimensions
- Geography — country and city of the visitor (derived from IP address).
- Device — mobile, tablet, or desktop.
- Browser — Chrome, Safari, Firefox, etc.
- OS — Windows, macOS, iOS, Android, etc.
- Referrer — the website or app that sent the visitor to your link.
Date range
Use the date picker at the top of the analytics page to filter by any custom range. Presets include Last 7 days, Last 30 days, and This month.
Conversion funnel
The funnel view shows how many visitors progressed through each stage: Clicked → Landed → Converted. This is particularly useful for measuring influencer campaign effectiveness.
Was this article helpful?
Still stuck? Contact our support team